
Total: 153
Full Time Equivalent: 144
Mayden’s headcount increased by about 10% in the reporting period. Its continued growth represents an additional challenge in the context of reducing overall emissions.
Mayden is committed to achieving Net Zero emissions by 2050.
Baseline Year: Financial year 2023 – 2024
Additional Details relating to the Baseline Emissions calculations.
Working from Home (WFH) emissions data is continuously gathered via an internal spreadsheet where employees self-report their place of work each week, the calculations are based on official ‘UK Government GHG Conversion Factors for Company Reporting’ 2023.
Currently our highest priority with Scope 3 is to measure and reduce a subset of our emissions in line with the National Health Service supplier reporting requirements for 2024, these are categorised below. As a supplier of digital products we do not have emissions from upstream or downstream transportation, we work on a hybrid basis between 2 small offices and working from home – therefore our office waste is minor and we have measures in place for recycling and composting where possible (see projects section). Business travel data was obtained from our internal timesheet system and expense reports. There is specific outsourcing of our carbon emissions through our data hosting, such as AWS. This indirect contribution to carbon emissions will need to be reviewed in the future.
Employee Commuting – Commuting values were obtained from a staff survey in 2023 for which
we got a 75% return rate.
| EMISSIONS | TOTAL (tCO2e) | |
| Location-based* | Market-based* | |
| Scope 1 | 0 | 0 |
| Scope 2 | 53.82 | 62.78*** |
| Main Office | ||
| Electricity | 13.88 | 21.4 |
| Gas | 18.9 | 18.9 |
| Widcombe Office / iO Academy | ||
| Electricity | 2.66 | 4.1 |
| Gas | 18.38 | 18.38 |
| Scope 3 (Included Sources) | 102.04 | 102.04 |
| Working from Home | 41.04 | 41.04**** |
| Employee Commuting | 40.24 | 40.24 |
| Upstream transportation and distribution | 0 | 0 |
| Third part outsourcing - hosting AWS etc | TBC | TBC |
| Downstream transportation and distribution | 0 | 0 |
| Waste generated in operations | 0 | 0 |
| Business travel | ||
| - Personal road vehicles | 4.85 | 4.85 |
| - Air | 11.06 | 11.06 |
| - Rail | 4.85***** | 4.85***** |
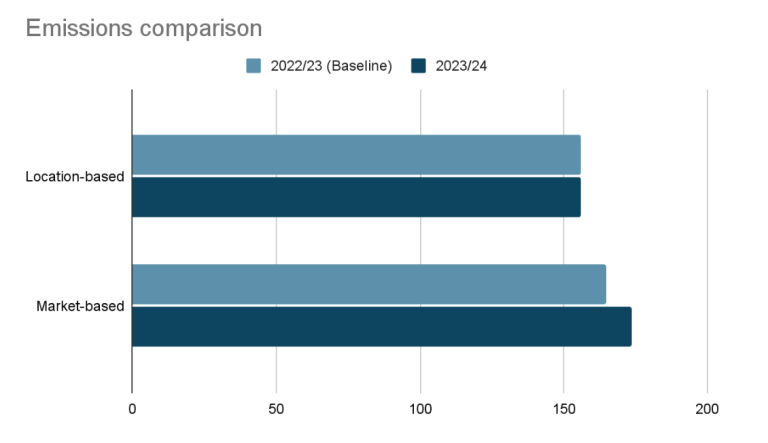
| Total Emissions | 155.86 | 164.82 |
Scope 1
No changes since previous year
Scope 2:
Working from Home (WFH) emissions data was again gathered via an internal spreadsheet where employees self-report their place of work each week, the calculations are based on official ‘UK Government GHG Conversion Factors for Company Reporting’ 2023.
Scope 3:
Employee Commuting – We based current numbers off commuting values obtained from a staff survey in 2023 for which we got a 75% return rate. As the business has grown since our baseline year we have adjusted the value for the current number of FTE Employees. We will revisit the process for obtaining this data in forthcoming years.
| Emissions Source | TOTAL (tCO2e) | |
| Location-based* | Market-based** | |
| Scope 1 | 0 | 0 |
| Scope 2 | 46.91 | 64.48 |
| Main Office | ||
| - Electricity | 11.89 | 26.36*** |
| - Gas | 16.98 | 16.98 |
| Widcombe Office / iO Academy | ||
| - Electricity | 2.55 | 5.65*** |
| - Gas | 15.49 | 15.49 |
| Scope 3 (Included Sources) | 109.09 | 109.09 |
| Working from Home | 49.25 | 49.25**** |
| Employee Commuting | 41.45 | 41.45 |
| Upstream transportation and distribution | 0 | 0 |
| Third part outsourcing - hosting AWS etc | TBC | TBC |
| Downstream transportation and distribution | 0 | 0 |
| Waste generated in operations | 0 | 0 |
| Business travel | ||
| - Personal road vehicles | 5.68 | 5.68 |
| - Air | 7.03 | 7.03 |
| - Rail | 5.68***** | 5.68***** |
| Total Emissions | 156.00 | 173.57 |
This site uses cookies. By continuing to browse the site you are agreeing to our use of cookies. Review our cookies information for more details.
| Cookie | Duration | Description |
|---|---|---|
| lang | session | LinkedIn sets this cookie to remember a user's language setting. |
| li_gc | 5 months 27 days | Linkedin set this cookie for storing visitor's consent regarding using cookies for non-essential purposes. |
| lidc | 1 day | LinkedIn sets the lidc cookie to facilitate data center selection. |
| Cookie | Duration | Description |
|---|---|---|
| _ga | 1 year 1 month 4 days | Google Analytics sets this cookie to calculate visitor, session and campaign data and track site usage for the site's analytics report. The cookie stores information anonymously and assigns a randomly generated number to recognise unique visitors. |
| _ga_* | 1 year 1 month 4 days | Google Analytics sets this cookie to store and count page views. |
| _gat_gtag_UA_* | 1 minute | Google Analytics sets this cookie to store a unique user ID. |
| _gid | 1 day | Google Analytics sets this cookie to store information on how visitors use a website while also creating an analytics report of the website's performance. Some of the collected data includes the number of visitors, their source, and the pages they visit anonymously. |
| CONSENT | 2 years | YouTube sets this cookie via embedded YouTube videos and registers anonymous statistical data. |
| Cookie | Duration | Description |
|---|---|---|
| bcookie | 1 year | LinkedIn sets this cookie from LinkedIn share buttons and ad tags to recognize browser IDs. |
| bscookie | 1 year | LinkedIn sets this cookie to store performed actions on the website. |
| VISITOR_INFO1_LIVE | 5 months 27 days | YouTube sets this cookie to measure bandwidth, determining whether the user gets the new or old player interface. |
| YSC | session | Youtube sets this cookie to track the views of embedded videos on Youtube pages. |
| yt-remote-connected-devices | never | YouTube sets this cookie to store the user's video preferences using embedded YouTube videos. |
| yt-remote-device-id | never | YouTube sets this cookie to store the user's video preferences using embedded YouTube videos. |
| yt.innertube::nextId | never | YouTube sets this cookie to register a unique ID to store data on what videos from YouTube the user has seen. |
| yt.innertube::requests | never | YouTube sets this cookie to register a unique ID to store data on what videos from YouTube the user has seen. |
| Cookie | Duration | Description |
|---|---|---|
| li_alerts | 1 year | Description is currently not available. |
| VISITOR_PRIVACY_METADATA | 5 months 27 days | Description is currently not available. |